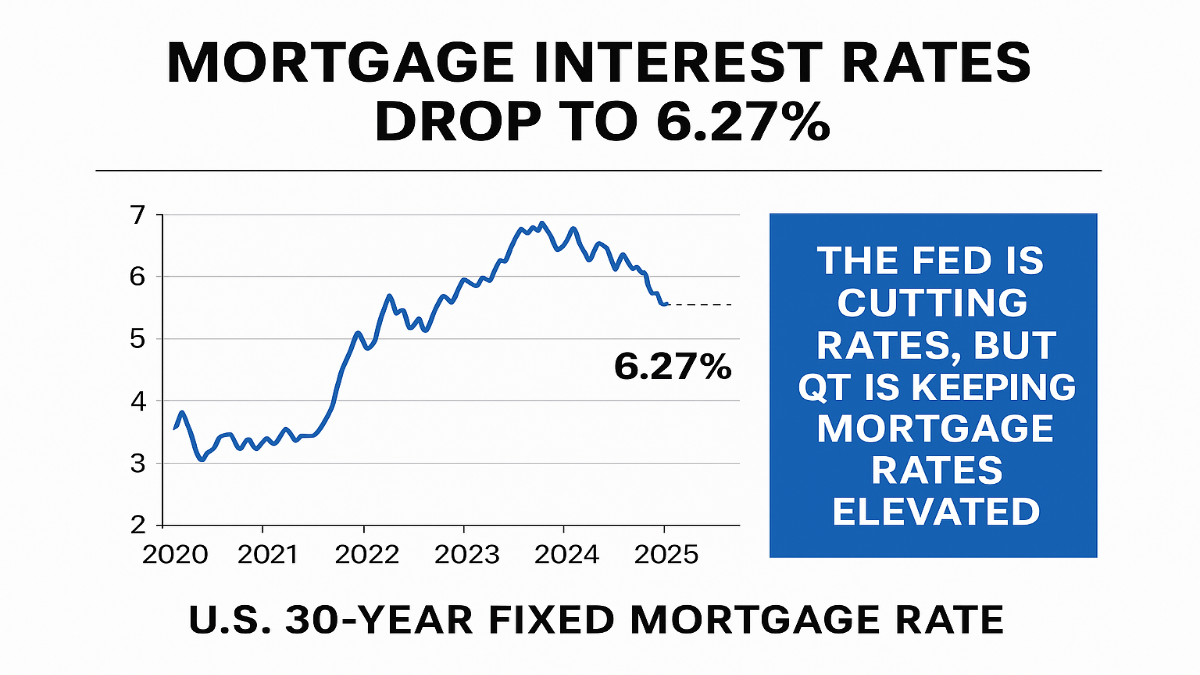
U.S. 30-year fixed mortgage interest rates slipped to 6.27% this week, offering slight relief; yet, the rate remains high, driven not by the Fed’s short-term cuts but by a widening risk spread tied to quantitative tightening.
As of October 16, 2025, the average 30-year fixed mortgage interest rate dropped for the second consecutive week, settling at 6.27%, according to Freddie Mac’s Primary Mortgage Market Survey.1 This modest decline follows the Federal Reserve’s September move to cut the short-term Federal Funds Rate, reflecting mounting downside risks to the U.S. labor market.3 However, prospective buyers should know that long-term borrowing costs remain stubbornly elevated, held captive by macroeconomic forces—specifically, the high risk premium demanded by investors in the mortgage bond market.
Executive Summary: The 6.27% Reality and the Policy Paradox
The financial narrative surrounding mortgage interest rates is currently defined by a profound paradox: the nation’s central bank is actively easing its short-term policy, yet the cost of long-term housing debt remains prohibitive for millions of Americans. While the prevailing 30-year fixed rate of 6.27% indicates a general moderation compared to its recent peak—and is notably below the 6.44% recorded one year ago—it still stands far above the historic lows seen just four years ago.5
The disconnect between the Federal Reserve’s actions and the housing market’s reality is the key challenge facing policymakers and consumers alike. The Fed successfully executed a 25-basis point (bps) cut to its benchmark Federal Funds Rate (FFR) in September 2025, lowering the target range to 4.00%-4.25%.3 Traditionally, such a signal of easing policy would rapidly translate into lower borrowing costs across the economy. However, the 30-year mortgage rate dropped only marginally this week (by 0.03 percentage points).1
This marginal decline underscores a complex reality: the FFR primarily influences short-term bank lending, while long-term rates, such as those for mortgages, are governed by the 10-year Treasury yield and a critical, often-overlooked factor known as the mortgage spread.8 The modest relief observed is primarily the market’s response to concerns that the Fed’s easing campaign is insufficient to overcome entrenched long-term challenges, including high inflation expectations reflected in Treasury yields and structural liquidity issues tied to the Federal Reserve’s balance sheet policy—a factor known as the secondary spread.9 For consumers, this translates to cautious optimism being tempered by the persistent feeling that rates will not plunge rapidly anytime soon.
Current State of U.S. Mortgage Interest Rates and Market Activity
Providing definitive figures is essential for understanding the current market environment. The weekly survey data from Freddie Mac and the Mortgage Bankers Association (MBA) offers the most reliable snapshot of borrowing costs for conventional loans.
A. The Latest Primary Mortgage Market Survey (PMMS) Data
As of October 16, 2025, the Primary Mortgage Market Survey (PMMS) data showed slight but meaningful movement downward for the second straight week.
The benchmark 30-Year Fixed-Rate Mortgage (FRM) fell to 6.27%, a decrease of 0.03 percentage points from the previous week’s 6.30%.1 For homeowners considering refinancing, the 15-Year Fixed-Rate Mortgage (FRM) also edged lower, dropping to an average of 5.52%, down slightly from 5.53% a week earlier.1 The current 30-year rate is hovering just above the lowest point observed in 2025, which was 6.26%.5
While the Freddie Mac survey focuses on conventional, conforming loans for highly qualified borrowers, data from the Mortgage Bankers Association (MBA) provides context on the wider lending landscape. MBA’s reporting indicates a 30-year fixed rate average of 6.42% recently, reflecting a minor weekly decline of 0.01 percentage points. Notably, the MBA reported that 30-Year Jumbo loans experienced a more significant drop of 0.13 percentage points, settling at 6.47%.10
Table 1 details the current rate environment, illustrating the slight moderation across key loan types.
Table 1: Current US Mortgage Rate Snapshot (As of October 16, 2025)
| Loan Type | Average Interest Rate | Source | Week-over-Week Change | One Year Ago (Approx.) |
| 30-Year Fixed-Rate Mortgage (FRM) | 6.27% | Freddie Mac PMMS 1 | -0.03% 1 | 6.44% 5 |
| 15-Year Fixed-Rate Mortgage (FRM) | 5.52% | Freddie Mac PMMS 1 | -0.01% 1 | 5.63% 5 |
| 30-Year Fixed (Purchase) | 6.42% | MBA 10 | -0.01% 10 | N/A |
| 30-Year Jumbo | 6.47% | MBA 10 | -0.13% 10 | N/A |
B. Market Reaction and Homeowner Behavior
The recent movement, though small, has affected market dynamics. Economists at Freddie Mac observe that homeowners, having noticed these consistently lower rates compared to earlier peaks above 7%, have begun engaging in an “uptick in refinance activity”.11
However, this increased activity is highly selective. Widespread, systemic refinancing remains severely constrained. For refinancing to become a broadly attractive option, rates must drop below the 6% threshold. This is because approximately 80% of current U.S. homes with a mortgage already hold a rate below 6%, and more than half (53%) have a rate below 4%.12 Only those who purchased or refinanced during the last two years at higher rates are likely to benefit from the current average of 6.27%, meaning overall mortgage application volume remains subdued.13
The Mechanics of Long-Term Mortgage Rate Determination
Understanding why mortgage interest rates behave differently from the Federal Funds Rate requires a precise explanation of the long-term borrowing formula. Long-term mortgage rates are not set directly by the Fed, but rather by combining two core components: the benchmark Treasury yield and the mortgage spread.8
A. The 10-Year Treasury Benchmark
The foundational element of the 30-year mortgage rate is the yield on the 10-year U.S. Treasury Note.8 Lenders use this bond as the primary benchmark for home loan pricing because the 10-year maturity duration closely aligns with the average lifespan of a 30-year mortgage, considering the high likelihood that a borrower will refinance or sell the home within that period.8
As of October 17, 2025, the 10-year Treasury yield stood at approximately 4.01%.14 This yield has exhibited volatility, rising slightly in the most recent session but generally trending lower over the past month. The overall easing in Treasury yields is the primary source of the recent marginal relief in mortgage rates. This easing is largely driven by bond market investors anticipating further economic cooling and the Federal Reserve’s projected rate cuts, which translate into a lower long-term cost of government borrowing.5
B. Deep Dive: The Mortgage Spread Anomaly
The critical point of concern for housing affordability lies in the gap between the mortgage rate (6.27%) and the 10-year Treasury yield (4.01%). This difference—a spread of over 226 basis points—is historically wide and acts as a significant headwind against lower rates.8 This mortgage spread is itself broken into two components, each reflecting distinct costs and risks.
1. The Primary-Secondary Spread (Lender Costs)
The primary-secondary spread represents the difference between the rate offered to the borrower and the rate ultimately earned by the investors holding the Mortgage-Backed Security (MBS). This component accounts for the costs associated with originating and servicing the loan, including processing fees, guaranty fees paid to entities like Fannie Mae and Freddie Mac, and the lender’s required profit margins.8
Following the Great Financial Crisis, these costs became structurally higher, leading to a permanent increase in this part of the spread, though it is the less volatile of the two components.8
2. The Secondary Mortgage Spread (Investor Risk and Liquidity)
The secondary mortgage spread is the difference between the yield on the Mortgage-Backed Security (MBS) and the 10-year Treasury yield. This difference exists to compensate investors for taking on risks inherent in holding mortgage debt that are absent when holding pure Treasury bonds.8
The main risks include:
- Prepayment Risk: Unlike a Treasury bond, which guarantees interest payments for its full term, mortgage borrowers may pay off their loan early by refinancing or selling the house. This risk forces MBS investors to reinvest their capital sooner, potentially at lower prevailing rates.8
- Credit Risk: Although Agency MBS are government-backed, the spread also accounts for market liquidity and the risk associated with the guarantors themselves.8
Current long-term rates are fundamentally higher because this secondary spread has widened dramatically since the COVID-19 pandemic. Analysis shows that the average secondary spread post-COVID (from early 2022 through late 2024) has averaged 1.4 percentage points, significantly higher than the 0.71 percentage point average observed between 2012 and 2019.8
This structural widening demonstrates that even if the 10-year Treasury yield were to fall significantly—for instance, back to 3%—the final 30-year mortgage rate would still remain stuck around 5% to 5.5% because the required risk premium is now higher. This means that achieving the ultra-low rates seen in the 2020-2021 era without massive, sustained intervention by the Federal Reserve is highly improbable under current market conditions. The housing finance market now carries a permanent, higher-cost risk premium.
Macroeconomic Forces: The Fed’s Dual Policy and Quantitative Tightening
The primary explanation for the stubborn level of current mortgage interest rates is the Federal Reserve’s attempt to execute two fundamentally contradictory policies simultaneously: cutting short-term rates to stave off recession while shrinking its balance sheet to normalize financial markets.
A. The Federal Reserve’s Easing Cycle
In September 2025, the Federal Open Market Committee (FOMC) initiated a new easing cycle by reducing the federal funds rate by 25 basis points, bringing the target range down to 4.00%-4.25%.3 This decision marked the first reduction in borrowing costs for the U.S. economy in nearly a year.16
The official justification for this shift was rooted in the central bank’s dual mandate of maximum employment and price stability. Policymakers noted increased downside risks to employment and cited a moderation in economic activity during the first half of the year, coupled with an edging up of the unemployment rate.4 The economic data supported this concern: U.S. nonfarm payroll employment increased by only 22,000 jobs in August 2025, signaling a substantial slowdown in the labor market’s recovery phase.17
Fed officials projected further policy easing, anticipating “two more cuts this year” and one additional cut in 2026.5 Markets have largely absorbed this guidance, with futures markets indicating a high probability (around 97%) that the FOMC will deliver another 25 bps cut in the upcoming October meeting.18 This commitment to easing serves to anchor expectations for lower short-term rates, which in turn helps push the 10-year Treasury yield downward.
However, the easing path is fragile. Inflation, measured by the Personal Consumption Expenditure (PCE) price index, was 2.7% year-over-year in August 2025—still above the Fed’s 2% target.19 Escalating global trade tensions, particularly new tariff measures and trade disputes with China, pose a risk of injecting unexpected inflation into the economy.5 If such pressures materialize, the Fed could be forced to halt its rate-cutting campaign entirely, which would immediately reverse the current downward trajectory of Treasury yields and cause long-term mortgage interest rates to spike again.
B. The Shadow Policy: Quantitative Tightening (QT) and MBS
The principal reason the Fed’s short-term rate cuts are failing to deliver substantial relief to long-term mortgage borrowers is the simultaneous process of Quantitative Tightening (QT).
Under QT, the Fed is aggressively shrinking its $6.6 trillion balance sheet by allowing assets to mature without reinvestment.20 Crucially, this includes allowing up to $35 billion per month in agency Mortgage-Backed Securities (MBS) to roll off its holdings.4
This policy directly increases the secondary mortgage spread. When the Fed purchased MBS during the Quantitative Easing (QE) phases, it acted as a massive, rate-insensitive buyer, suppressing the spread and lowering mortgage rates.21 Now, by stepping away, the Fed forces the private market—composed of rate-sensitive institutions and money managers—to absorb these $35 billion in assets monthly.20 These private investors demand a higher yield to take on the prepayment and credit risk associated with MBS, inevitably leading to the widening of the mortgage spread and keeping the final rate paid by the consumer elevated.8
This divergence represents a significant policy conflict. The Fed is easing monetary policy (rate cuts) to prevent a deep economic slowdown, yet its structural policy (QT on MBS) maintains high borrowing costs specifically for the housing sector, which acts as a powerful brake on economic activity and keeps homeownership inaccessible.
Investment experts have quantified the drag caused by this policy. Executives at PIMCO, a major global bond fund, have argued that the Fed could immediately reduce mortgage interest rates by 20 to 30 basis points simply by reinvesting the $18 billion in MBS principal payments that mature each month instead of allowing them to run off.22 This relief, they note, would be equivalent in magnitude to cutting the Federal Funds Rate by a full percentage point.23 Despite this analysis, Fed Chair Jerome Powell recently reaffirmed the Fed’s stance, suggesting that while QT may be “approaching the end of our balance sheet contraction in the coming months” due to perceived liquidity tightness, he explicitly ruled out direct intervention in secondary mortgage markets to ease rates.20 This confirms that the Fed is prioritizing long-term balance sheet reduction over immediate housing affordability, treating the persistent high mortgage rate as a temporary, if unfortunate, side effect of broader macro-financial normalization.
Historical Context: The Climb and the Current Plateau
The current 6.27% rate cannot be fully assessed without understanding the tumultuous period of rate acceleration that preceded it, which permanently reshaped borrower expectations.
A. The Great Rate Acceleration (2021–2025)
The trajectory of mortgage interest rates over the past four years demonstrates a radical shift in the cost of debt. Following the onset of the pandemic, the Federal Reserve’s massive bond-buying programs (QE) pushed the average 30-year FRM rate down to an unprecedented low of approximately 2.96% in 2021.6 This era of ultra-low rates fueled intense housing demand and rapid appreciation.
The environment shifted dramatically in 2022 when the Fed began aggressively raising the FFR to combat spiking inflation. Long-term rates soared, doubling within a year. Rates eventually peaked just above 7% in January 2025, creating a profound affordability shock and severely freezing transaction volume in the housing market.5
Since late 2022, the market has settled into a high-cost plateau. The 30-year average has remained stubbornly above 6%, despite recent minor fluctuations. This stability, even at elevated levels, marks a long-term shift where the cost of borrowing is double that of the recent historical norm, creating new realities for both buyers and existing homeowners.
Table 2 provides a brief timeline of the rate acceleration and the major macroeconomic milestones driving the cost of housing finance.
Table 2: Mortgage Rate Timeline and Key Economic Events (2021–2025)
| Date/Period | Key Economic Event/Rate Status | 30-Year FRM Rate (Approx.) | Contextual Impact |
| 2021 Average | Aggressive QE, near-zero FFR | 2.96% 6 | Unprecedented affordability; fueled massive demand and rapid home price appreciation. |
| Sept 2022 | Rates breach 6%; QT fully underway | ~6.70% | Initial major affordability shock; began the “lock-in” effect for existing owners. |
| Jan 2025 | Recent Rate Peak | Just above 7.00% 13 | Housing market transactions froze; affordability reached crisis levels. |
| Sept 2025 | Federal Reserve cuts Fed Funds Rate | 6.30%–6.49% 9 | First FFR cut in a year; mixed signal for housing due to QT drag. |
| Oct 16, 2025 | Latest Freddie Mac PMMS release | 6.27% 1 | Current plateau; modest decline linked to cooling labor market data. |
Human Impact: Affordability Crisis and the Inventory Trap
The combination of 6%+ mortgage rates and persistently high home prices has solidified an acute affordability crisis for American homebuyers. The required income level to purchase a median-priced home today far outstrips typical wage growth, creating an unprecedented barrier to entry.
A. Quantifying the Cost of Entry
The affordability crunch is best understood through the lens of monthly payments. The median sales price for a new single-family home stood at approximately $416,900 in the first quarter of 2025.24 Lenders typically require that monthly housing costs, which include principal and interest (P&I), property taxes, and insurance (PITI), not exceed 28% of a borrower’s gross monthly income.25
Using the current rate environment, the disparity in monthly payments compared to the recent past is staggering. For illustrative purposes, an analysis of a $350,000 loan amount (roughly 85% of the median home price) reveals the financial burden imposed by the high rate structure.
Table 3: Affordability Comparison: Monthly P&I Payments
| Scenario Parameter | Loan Amount (Approx.) | Interest Rate | 30-Year Monthly P&I Payment | Annual Cost Difference (vs. Current) |
| Q1 2021 Low Rate | $350,000 | 2.96% | $1,470 | N/A |
| Current Market (Oct 2025) | $350,000 | 6.27% | $2,154 | +$8,208 |
| Buyer Goal (Below 6%) | $350,000 | 5.50% | $1,987 | -$2,004 |
Note: Calculations based on a $350,000 principal loan amount for a 30-year fixed-rate mortgage. Payments exclude property taxes, insurance, and PMI.25
A buyer securing a loan at the current 6.27% rate pays $684 more per month—or over $8,200 annually—in principal and interest alone compared to a buyer who financed during the low-rate environment of 2021. This substantial increase in debt service significantly raises the income required to qualify for a typical mortgage, effectively pricing hundreds of thousands of U.S. households out of the market.27
B. The “Golden Handcuffs” Effect
The second major consequence of high mortgage interest rates is the artificial constraint on housing supply, often called the “Golden Handcuffs” effect. This phenomenon is critical because the lack of existing home inventory is the primary factor preventing home prices from falling drastically, even amid high rates.24
The constraint is driven by the majority of existing homeowners who possess mortgages with highly attractive, low rates. As previously noted, about 80% of U.S. homes with outstanding mortgages have a rate below 6%, and over half have rates below 4%.12 These owners are financially locked into their current properties. Selling their home would force them to buy a new one and trade their 3% mortgage for a 6.27% mortgage, resulting in substantially higher monthly payments.
This reluctance to sell keeps the inventory of existing homes at historically low levels, transferring demand pressure to the new construction market.24 While builders are adapting—constructing smaller homes and increasingly using sales incentives, such as offering to buy down the buyer’s mortgage rate—the scarcity of existing inventory maintains upward pressure on overall housing values, ensuring that the affordability crisis persists on both the price and rate fronts.24
Strategic Advice for Navigating High Mortgage Interest Rates
In a market defined by high costs and low inventory, buyers must adopt pragmatic and disciplined financial strategies. Experts concur that waiting indefinitely for a major rate plunge is not a feasible approach, given the structural nature of the current spread.29
A. Advice for Prospective Buyers
- “Marry the House, Date the Rate”: This mantra suggests buyers should secure the right home when they find it, provided they can comfortably manage the monthly payment at the current rate.30 The assumption is that the rate is temporary, and the borrower can refinance later if rates drop significantly, usually to a point where the monthly savings outweigh the refinancing costs.29 Locking in the interest rate immediately after loan approval is a critical protective step, given that rates fluctuate daily.31
- Negotiate Seller Concessions and Rate Buydowns: With the market environment softening slightly, buyers have increasing leverage. Negotiating for seller-paid rate buydowns is one of the most effective ways to mitigate the high current rate.30 A temporary buydown (e.g., 2/1 buydown) can reduce the buyer’s effective interest rate into the 4% or 5% range for the first one to three years, easing initial payments while waiting for a potential market shift.30 Moreover, buyers should negotiate closing cost credits or request the seller to cover necessary repairs.31
- Shop Multiple Lenders: The importance of comparing offers cannot be overstated. Research from Freddie Mac estimates that a buyer who compares quotes from at least four different lenders could save as much as $1,200 annually on their mortgage payments.32 Shopping lenders ensures the borrower secures the most competitive interest rate, fees, and Annual Percentage Rate (APR) for their specific financial profile.31
- Know Your Loan Options: First-time buyers should be aware of the variety of loan products available, including Conventional loans (down payments as low as 3%), FHA loans (3.5% down), and government-backed options like VA and USDA loans (both offering 0% down for eligible borrowers). Each loan type has different eligibility, mortgage insurance, and closing cost requirements.32
B. Refinancing Outlook
For existing homeowners, the opportunity to refinance remains limited but is slowly expanding. Current 30-year fixed refinance rates are typically slightly higher than purchase rates, averaging around 6.58% as of October 18, 2025.33
As discussed, widespread refinancing activity will not materialize until the average 30-year rate consistently falls below 6%.12 Currently, refinancing is only a viable strategy for the smaller segment of homeowners who acquired loans at the highest rates over the past year or two, or for borrowers seeking a cash-out refinance to tap into equity for purposes such as debt consolidation or home improvement.34
The Path Forward: Forecasts and Implications
The trajectory of U.S. mortgage interest rates for the next six to twelve months will be determined by three interconnected factors: the severity of the economic slowdown, the Federal Reserve’s pace of short-term rate cuts, and, most critically, the future of its Quantitative Tightening policy.
A. Expert Forecast and Market Consensus
The general consensus among financial analysts and housing economists is that the average 30-year mortgage rate will remain near the mid-6% range through the remainder of 2025.12 The current rate environment is characterized by stability at an elevated level.11 CEO Tony Julianelle anticipates that rates will “ease modestly into year-end, but I wouldn’t frame this as a straight-line story”.13
CME FedWatch data shows strong market anticipation of continued easing, with high probabilities of 25 bps cuts at the upcoming FOMC meetings.18 These expectations are already largely factored into the current 10-year Treasury yield, meaning further FFR cuts may result in only incremental drops in long-term mortgage rates due to the enduring friction caused by the wide mortgage spread.
B. Implications for Housing and Policy
The market’s primary dynamic now involves a slow, complex adjustment toward a more functional, high-cost equilibrium. The relative stability of rates near 6.27% allows market participants—buyers, sellers, and builders—to adjust their financial expectations.11
The structural issue of housing affordability, however, demands a policy solution that goes beyond the FFR. The greatest potential lever for immediate, substantial housing relief rests entirely with the Federal Reserve’s balance sheet. A decision to cease or significantly slow the runoff of Mortgage-Backed Securities—a change advocated by influential investment firms—would immediately increase demand for MBS, narrow the secondary spread, and provide a direct path for mortgage interest rates to drop by 20 to 30 basis points without the need for additional short-term rate cuts.22
The current environment, characterized by elevated rates, coupled with increased housing inventory (driven by builder adaptation) and slower house price growth, is moving toward a “more favorable environment for those looking to buy a home,” according to Freddie Mac economists.11 This shift, however, primarily benefits highly qualified buyers who possess substantial cash reserves or are willing to engage in strategic negotiations to mitigate the high cost of financing. The era of cheap money for housing is definitively over, replaced by a complex, tightly controlled market where policy decisions outside of the Federal Funds Rate hold immense sway over consumer costs