Financial markets opened in September on a shaky note. U.S. stock indexes sank on Tuesday, Sep 2, 2025, as investors braced for key economic data. According to Reuters, “Wall Street’s main indexes hit a more than one-week low on Tuesday” as the holiday weekend ended and traders eyed a critical jobs report. The Dow Jones Industrial Average (DJIA) fell roughly 0.6–0.8%, the S&P 500 dropped nearly 1%, and the Nasdaq Composite slid about 1%. Markets are unusually cautious: September is historically the worst month of the year for stocks, and a weak August jobs report has fueled expectations of Federal Reserve rate cuts.
Dow Jones Today: Stock Market News, Futures, S&P 500 & Nasdaq Update
- Market Recap: U.S. stock indexes opened September with losses. The Dow Jones Industrial Average fell on the order of 0.6–0.8% (about 280–450 points), the S&P 500 declined by around 0.8–1%, and the Nasdaq Composite dropped by roughly 0.98–1.3%. This muted start follows a strong August: the S&P 500 still gained about 1.9% in August, but seasonal headwinds loomed.
- Treasury Yields Spike: Long-term U.S. Treasury yields jumped, pushing interest rates higher and pressuring stocks. The 30-year Treasury yield neared 5% (its highest since July), and the 10-year was around 4.3% in early trading. Rising yields especially weigh on high-priced tech shares.
- Gold and Safe Havens: Gold surged to an all-time high above $3,500 per ounce amid rate-cut bets. Record gold prices and related stock moves helped, for example, gold miners jumped (e.g., Harmony Gold +5.6%). Investors turned to safe havens as Fed easing hopes grew.
- Tech Stocks Drag: Tech-heavy names underperformed. Nvidia, Apple, Microsoft, and others saw losses (e.g., NVDA –1.5%, AAPL –0.8% by mid-morning). The so-called “Magnificent Seven” tech giants pulled the Nasdaq down; Alphabet and Amazon fell over 2% in the session.
- Policy Uncertainty: Major policy issues loomed. A U.S. appeals court ruled most of President Trump’s tariffs illegal last week, adding trade uncertainty. Investors also watched Fed independence issues (a court review of Trump’s attempt to oust Fed Governor Lisa Cook) and awaited the Fed’s response to economic data.
- Fed & Jobs on Radar: The key jobs report (Sept 5) and Fed meetings are in focus. Markets now price in ~90% odds of a 25-basis-point rate cut in September. Traders will scrutinize August payrolls, job openings and inflation figures – a much-weakened labor market could cement Fed cuts, while stronger data might shake expectations.
Together, these factors set the tone for trading. The chart above (from TradingView or similar platforms) shows declining index values as stock market futures and global cues pointed lower. Investors use tools like TradingView to follow real-time quotes for the Dow Jones, S&P 500, Nasdaq, and related futures as events unfold.

Dow Jones & DJIA Today
The Dow Jones Industrial Average (DJIA), often called “the Dow,” is a price-weighted index of 30 large U.S. companies. It serves as a barometer of the U.S. stock market. On Tuesday, the Dow opened lower. By mid-session, it was down roughly 282 points (–0.62%) at about 45,262. By end-of-day it traded around a 0.8% loss. Investors saw declines among most Dow components, especially industrial and tech-related names.
Today’s drop in the Dow reflects broad selling. Defensive stocks like utilities or consumer staples held up relatively better; for example, PepsiCo rallied +3.6% as activist investor Elliott disclosed a $4 billion stake. But cyclical and technology-related stocks dragged the index down. Analysts note that rising bond yields (less attractive equities) and trade policy worries hit the Dow hard.
Futures and Technicals: Ahead of open, Dow futures (traded on the Chicago Mercantile Exchange) pointed lower by about 0.6%, indicating a rough start. On TradingView charts, the DJIA showed a morning gap down. Technical patterns suggest the Dow is testing support near recent lows. Volume was robust, meaning active trading. Many traders use platforms like TradingView or other broker charts to watch “Dow today” price moves, Dow futures, and intraday momentum. This morning’s decline underlines investor caution.
Sector & ETF Note: The Vanguard Industrials Index Fund (symbol VAW) and other Dow-based ETFs saw trading swings similar to the index. For portfolio investors, broad-market funds like the Vanguard S&P 500 ETF (VOO) also suffered as the S&P 500 fell. VOO, which tracks the S&P 500, provides exposure to Dow-like stocks plus others.
A smartphone screen and chart remind investors of the Dow Jones trend. Many track indices on apps while news like this shapes portfolios. Today, the Dow and related indices are signaling a risk-off mood.
S&P 500 & VOO Stock Update
The S&P 500 index (Standard & Poor’s 500) measures 500 large-cap U.S. stocks across all sectors. It’s broader than the Dow and is often used as a market proxy. On Tuesday, the S&P 500 fell about 54 points to ~6,406 (about –0.84%) by 10:04 am ET. By day’s close, it was down just over 1%. That follows August’s gains: the S&P had climbed ~1.9% in August, bringing its year-to-date gain to roughly 10%.
Despite the decline, some areas held up. Defensive sectors like Utilities and Staples outperformed, while Technology and Communication Services lagged. The pullback was relatively broad: “most S&P 500 sectors traded in the red,” Reuters noted, with tech names the biggest drags.
VOO ETF: The Vanguard S&P 500 ETF (VOO) mirrors the S&P 500. On Tuesday, it fell in line with the index. Investors often watch VOO as a gauge of S&P moves, and it is widely held in retirement accounts. The recent price of VOO (around $590–$600) reflected the index drop. As the S&P fell, VOO’s net asset value declined accordingly. For example, with the S&P down ~1%, VOO also lost about 1% of its value (roughly a $6 drop if near $600). This provides an easy way for everyday traders to trade the S&P 500 moves.
Key Drivers: Sector rotation influenced the S&P’s drop. The session saw weakness in cyclical names and momentum stocks. One notable story: Kraft Heinz announced a split into two companies, causing its stock to fall ~3%; that weighed on the Consumer Staples sector. Meanwhile, gold miners rallied on surging bullion, which slightly helped the Materials sector. Overall, however, the equity risk premium widened as yields rose.
Trading and Charts: S&P 500 futures (ticker ESM25, etc.) reflected the morning decline: futures fell about 0.8%. Many traders watch “S&P futures” on TradingView in the pre-market to gauge how U.S. markets open. As of this writing, chart indicators show the S&P breaking below minor support lines. A sustained move under 6,400 would worry bulls, so some traders may look to set stop-losses or hedge positions.
Nasdaq Composite & Technology Stocks
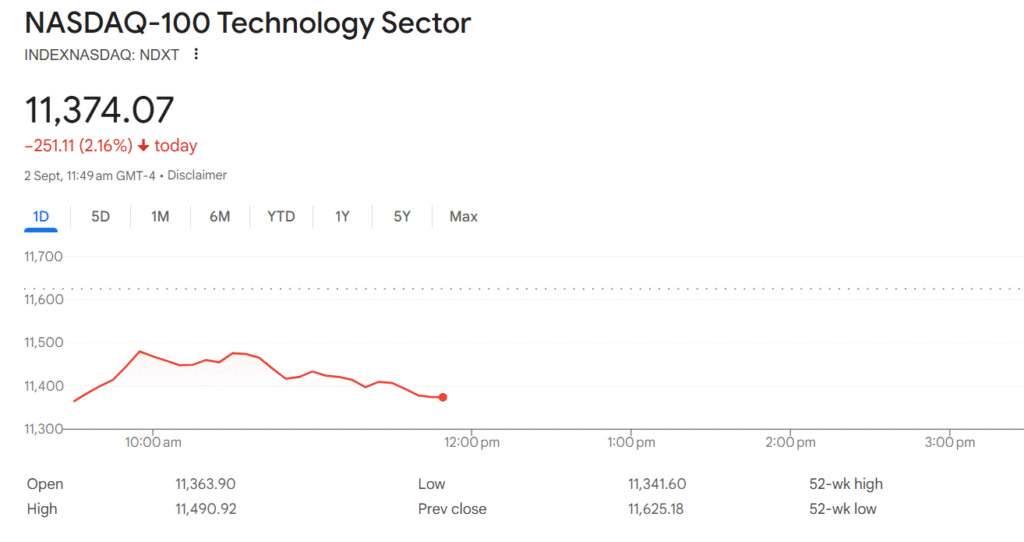
The Nasdaq Composite index, dominated by tech and growth companies, fell most sharply. It dropped ~0.98% by mid-morning to around 21,245 and ended the session down around 1.3%. For perspective, this was after five straight monthly gains for the Nasdaq going into September. The early September slide was led by the “Magnificent Seven” tech giants: Alphabet (GOOGL) and Amazon were particularly weak (each off ~2%), along with losses in NVIDIA, Apple, and Microsoft.
Investors attributed this tech pullback largely to rising interest rates and the unwinding of last month’s exuberance in AI and tech stocks. The shift in investor sentiment can be seen on platforms like TradingView as a widening red in tech-sector charts.
Nasdaq Futures: Nasdaq 100 futures (NQ) dipped about 1% in early trading. This reflects cautious sentiment ahead of earnings from big tech or chip companies this week. Nasdaq futures charts show the index testing the 21,300 level; falling below that could signal further short-term downside. Traders often watch “Nasdaq futures” tickers to time entries, and these show Nasdaq futures trading near multi-month highs just a week ago, now reversing course.
Market Breadth: Despite the slide, the Nasdaq still hit new 52-week highs on some stocks. On Tuesday, the Nasdaq Composite recorded 48 new highs, even with 48 new lows. This suggests mixed internal breadth. But overall declining issues outnumbered advancers on both the NYSE and Nasdaq – a bearish sign.
Market Futures & Trading Sentiment
Global equity futures (Dow, S&P, Nasdaq) all pointed lower in early Asia trading on Tuesday. For example, S&P 500 futures (ES) were down ~0.8%, Dow futures ~0.6%, and Nasdaq futures ~1%, aligning with the declines seen on Wall Street’s opening. That indicated Wall Street was set to follow through on early weakness.
TradingView & Platforms: Many traders use charting platforms (e.g., TradingView, Bloomberg Terminal) to watch these futures and spot trends. Keywords like “DJIA futures”, “Nasdaq futures”, and “S&P 500 trading view” are popular searches as investors scan for buying or selling signals. The sentiment on such platforms was bearish; high-volatility readings (the VIX index) spiked to near a 3-week high (~18), reflecting investor anxiety.
Economic Calendar: Market participants were waiting for U.S. economic updates. Key events this week include the Institute for Supply Management (ISM) manufacturing PMI on Tuesday (with August’s index rising to 48.7), and August payroll data on Friday. Strong data could dampen rate-cut bets, while weak data would support more Fed easing (and possibly a stock rally). Futures markets were pricing in roughly a 90–92% chance of a 25-basis-point Fed cut in mid-September, down slightly from near-certainty earlier. Traders know that if Friday’s jobs report comes in much weaker or stronger than the expected +75,000 payrolls, volatility could spike.
Bond & Currency Impact: In tandem, bond futures and yields gained attention. The yield on the 10-year U.S. Treasury climbed to around 4.30% (from ~4.23% pre-market) as stock losses. (Higher yields make stocks less attractive.) Conversely, the U.S. dollar eased slightly as global risk-off flows boosted gold. Speaking of gold, futures surpassed $3,550 (Dec contract), highlighting how rate-cut hopes are boosting non-yielding assets. Oil prices, by contrast, rose nearly 3% amid supply concerns, though energy stocks still underperformed on the day.
Economic Drivers: Fed, Jobs, and Policies
Investors’ minds are on the Federal Reserve and data releases. The strong expectation of a September rate cut is driving the narrative. Fed Chair Jerome Powell recently signaled that the Fed is prepared to cut if the economy slows, contributing to today’s market moves. According to the CME FedWatch tool, the odds of a 25-bp cut on Sept 17 were roughly 90%. This dovish tilt lifted August stocks but also paradoxically sent yields up (since long rates sometimes lead to near-term cuts).
Labor Market Focus: Friday’s U.S. nonfarm payroll report (August) is the week’s biggest event. A Reuters poll forecasts about +75,000 new jobs, which would be quite weak. July’s report was only +73,000 (far below estimates), fueling the Fed-cut bets. If August jobs disappoint again, markets may price in even larger rate cuts (perhaps a 50-bp move in September), which could further lift stocks and gold. Conversely, a surprisingly strong jobs figure could stall the easing cycle and bring stock volatility.
Inflation Data: Aside from jobs, any CPI or inflation readings this week can tweak Fed expectations. Note: Last week’s slightly disappointing U.S. inflation data had already dented stocks, reinforcing the belief that rate cuts are coming. Traders will also watch U.S. private payrolls and job openings data mid-week, which offer clues to Friday’s main report.
Trump’s Influence: Political factors are also at play. President Trump has been vocally pressuring the Fed to cut rates, and his recent moves have raised concerns. Last week, a federal appeals court ruled most of Trump’s tariffs illegal, but allowed them temporarily until mid-October. Trump criticized that decision and promised to appeal. In addition, Trump attempted to remove Fed Governor Lisa Cook, prompting a court hearing (no decision yet) on whether he can do so. Markets see these as threats to Fed independence. According to Reuters, the turmoil “has reignited concerns over the Fed’s credibility and its ability to conduct monetary policy free of political pressure”. Such uncertainty tends to increase market volatility and adds a bid to safe-havens like gold.
Sector and Stock Highlights
- Big Tech: Alphabet (Google) and Amazon led declines among the “Magnificent Seven,” each falling over 2%. Facebook parent Meta and Netflix also dipped. These companies’ valuations are highly sensitive to interest rates, so even slight yield increases can trigger outsized moves. For example, today’s drop in Google and Amazon contributed to the Nasdaq’s slide. Tech ETFs (like QQQ) and TradingView charts for NASDAQ showed noticeable red early on.
- Financials: Bank stocks fell as yields surged. Higher long-term rates often help banks’ net interest margins, but if short-term policy rates remain high, it can compress future profits. Investors might have been uncomfortable with the mix of rising yields and Fed-cut odds.
- Energy & Commodities: Oil futures jumped nearly 3% on supply concerns, yet many energy stocks didn’t gain as much. Inflation hedges like gold continued their rally: bullion’s climb to record highs (+33% YTD) made miners like Barrick and Newmont rally (Newmont +1.1%).
- Consumer & Industrial: Many industrial and consumer cyclicals fell, reflecting risk aversion. Retailers will be in focus this week for earnings updates, which could influence both sectors.
Trading and Analytics: Platforms and Tools
Investors and traders heavily use charting and news platforms to navigate such turbulent markets. TradingView, Bloomberg, Reuters screens, and brokerage platforms help monitor the DJIA today, the Nasdaq today, the SP 500, Dow futures, Nasdaq futures, etc. For example, one might chart the DJIA index with TradingView keywords like “DJIA chart September 2025” or “Nasdaq index technicals.” Many rely on such tools to set alert triggers if indices break support/resistance.
Market Sentiment Indicators: The CBOE Volatility Index (VIX) jumped to around 18, indicating increased fear. Some trading algorithms may have shifted to “risk-off” modes. Others watch volume: on the NYSE, declining stocks outnumbered advancing ones by nearly 3-to-1, signaling broad selling pressure.
Future Outlook: With major events ahead, trading desks highlight key “five things to know” for the week (e.g., Investopedia’s Sept 2 note). They advise watching futures (Nasdaq, S&P, Dow) and commodities. Given the Fed/journal and geopolitical factors, volatility should stay elevated. Many traders are hedged via index puts or inverse ETFs.
Global Markets and Context
U.S. stocks weren’t the only ones nervous. Asian markets fell on Tuesday – Japan’s Nikkei was up slightly, but China and Hong Kong indices were weak, reacting in part to U.S. cues and fading risk appetite. European stock futures also slipped. In currency markets, the yen and Swiss franc (safe havens) were stronger on safe-haven flows, while the dollar eased modestly as gold rallied.
One important global data point: U.S. ISM Manufacturing for August came in marginally better (48.7 vs. 48.0 prior), but still in contraction territory. This mixed signal added to the cautious tone.
Summary
In sum, the Dow Jones and broader U.S. market are starting September on defense. Stock market news today centers on caution and uncertainty:
- Major indexes down roughly 0.6–1.3%.
- Treasury yields are rising to multi-week highs.
- Gold at records above $3,500.
- The tech sector weakness is dragging the Nasdaq.
- Fed rate-cut expectations (near 90%) and a looming jobs report dominate sentiment.
Investors will be closely watching the rest of the week. If Friday’s jobs report is very weak, stocks and gold might rally further on renewed easing hopes. If it’s strong, we could see a quick rebound in yields and a rotation back to value stocks. Meanwhile, policy noise from Washington (tariffs, Fed independence) continues to add volatility.
For now, the “worst month” status of September looms large. Analysts note that since 1958, September is the only month the S&P tends to fall more often than rise. This historic pattern, combined with current uncertainties, means caution is wise. Monitoring index charts (DJIA, S&P, Nasdaq) on TradingView or brokerage platforms can help investors stay informed intraday. Keep an eye on keywords like DJIA today, S&P 500, Nasdaq futures, Dow futures, stock market today, and stock market news to track the latest data and analysis.
Also visit:-
MS Word: The Complete, Expanded Guide — Features, Functions, Advantages, and Practical Use
FAQs
- What is the Dow Jones?
The Dow Jones is a price-weighted index of 30 large U.S. companies and serves as a quick gauge of the U.S. stock market. Historically, the Dow Jones reflects blue-chip performance and broad investor sentiment. - How does the Dow Jones differ from the S&P 500?
Unlike the S&P 500, the Dow Jones is price-weighted rather than market-cap weighted, so a high-priced Dow Jones component can move the index more than a larger company with a lower share price. - Why did the Dow Jones fall today?
Short-term Dow Jones declines often follow rising Treasury yields, weak economic data, or risk-off headlines; traders watching the Dow Jones may sell to reduce exposure when those signs appear. - How can I follow Dow Jones futures?
You can follow Dow Jones futures on platforms like TradingView or your broker’s pre-market feed; set alerts for Dow Jones futures to see likely market direction before the cash open. - Does the Dow Jones affect ETFs like VOO?
VOO tracks the S&P 500, not the Dow Jones, but moves in the Dow Jones often mirror broader market trends that also move VOO because many large Dow Jones firms overlap with S&P constituents. - Can Dow Jones moves affect retirement portfolios?
Yes — large swings in the Dow Jones can change portfolio valuations, so long-term investors often look past short-term noise and stick to their diversification plan. - What indicators predict Dow Jones trends?
Analysts watch yields, jobs data, corporate earnings, and S&P 500 breadth as indicators for Dow Jones moves and broader market direction. - How often is the Dow Jones rebalanced?
The index committee reviews and occasionally adjusts Dow Jones components; changes are infrequent and are announced in advance to minimize disruption. - Is the Dow Jones a good short-term trading benchmark?
The Dow Jones can signal blue-chip strength, but short-term traders often prefer S&P or Nasdaq futures for greater liquidity and finer intraday moves. - Where can I get real-time Dow Jones updates?
Use Reuters, Bloomberg, TradingView, or your brokerage feed to get real-time Dow Jones quotes, charts, and breaking market news.